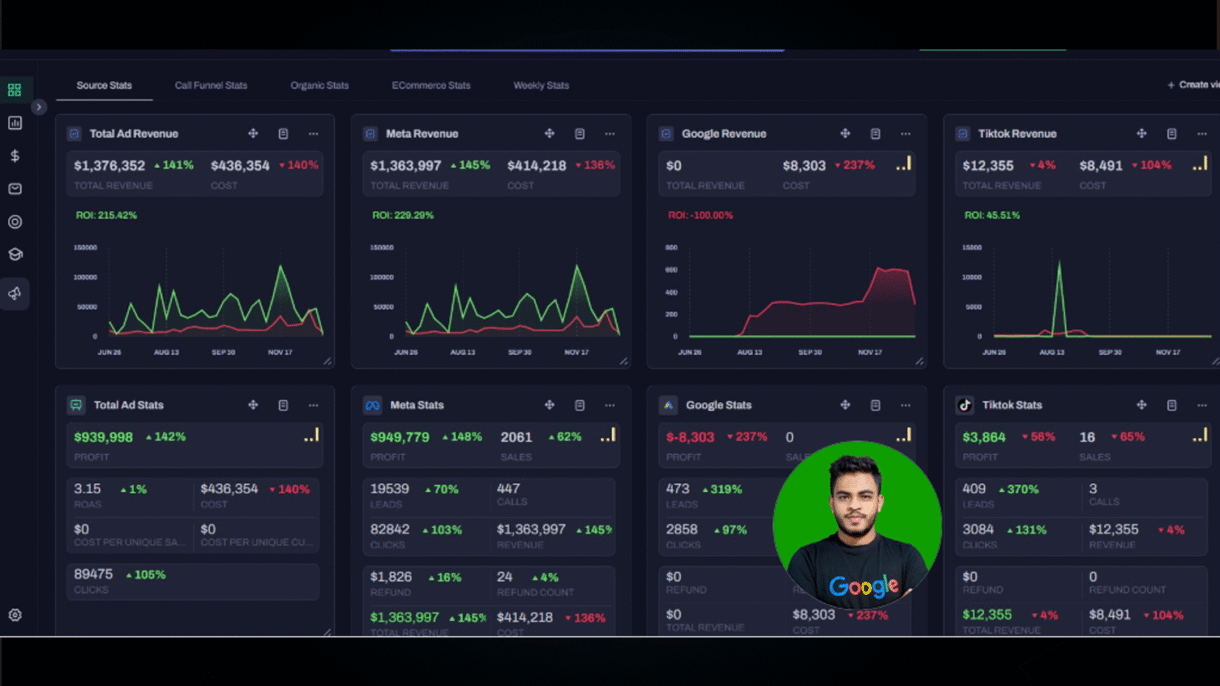
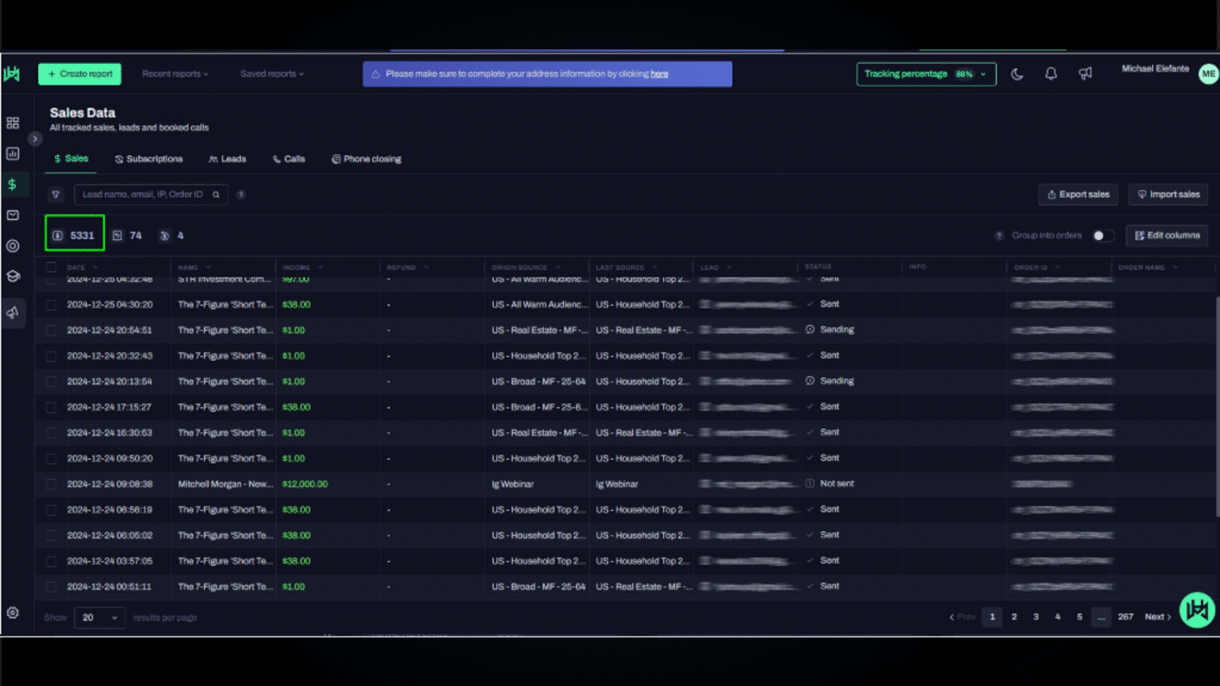
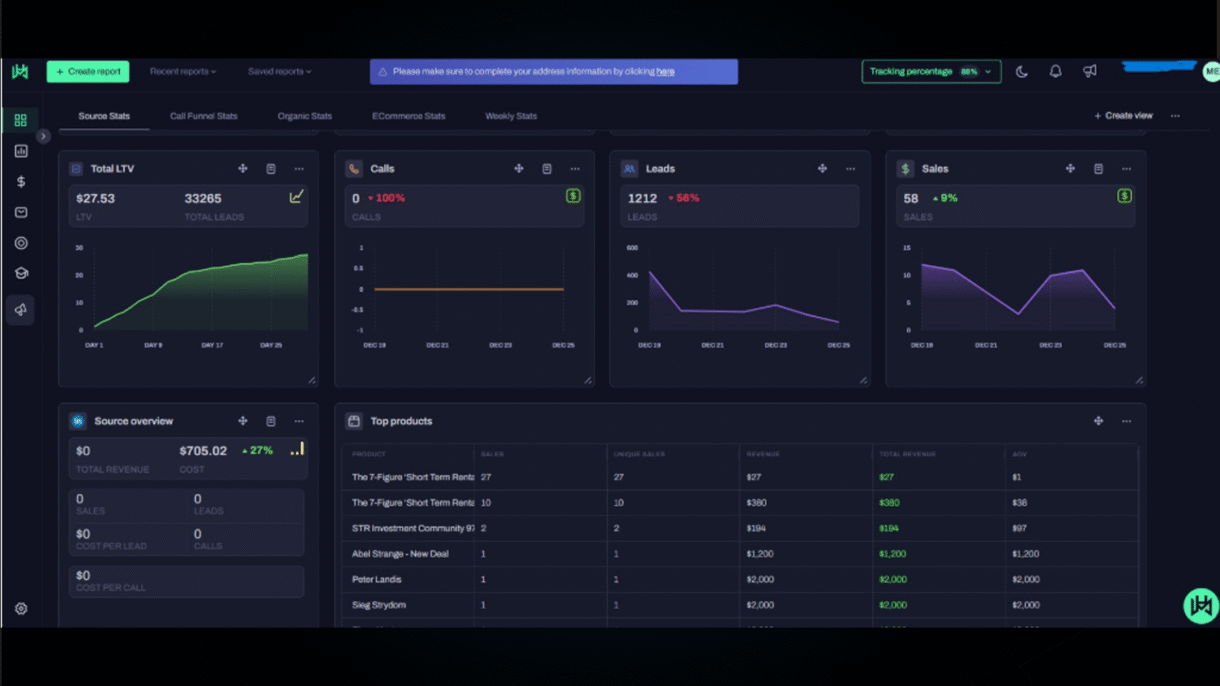
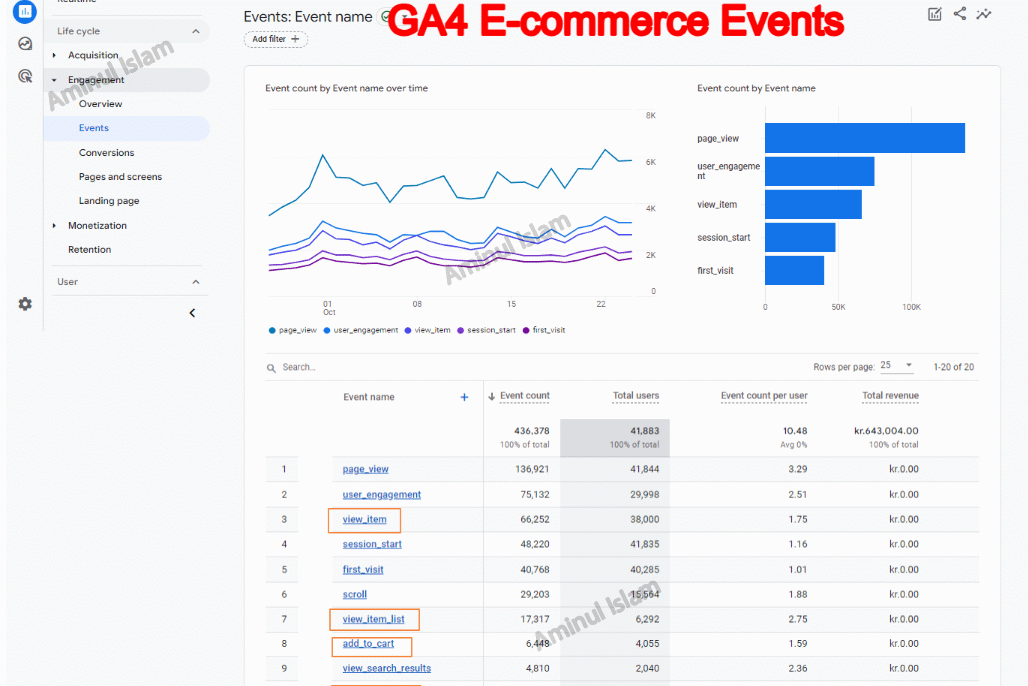
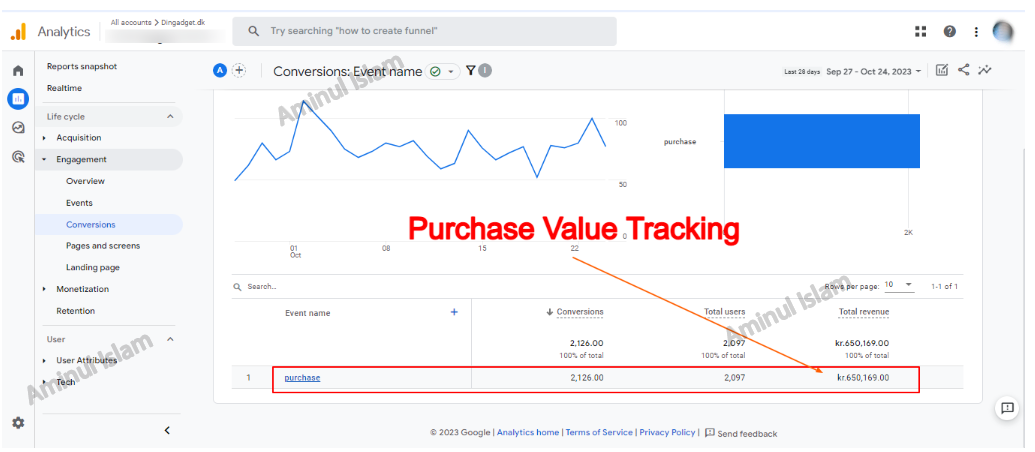
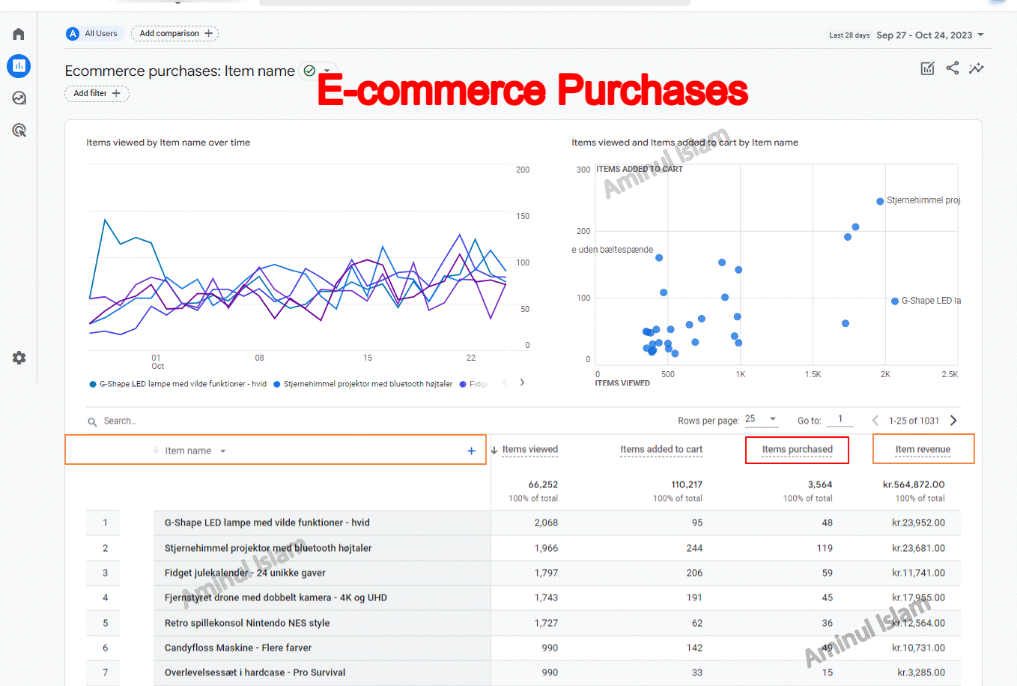
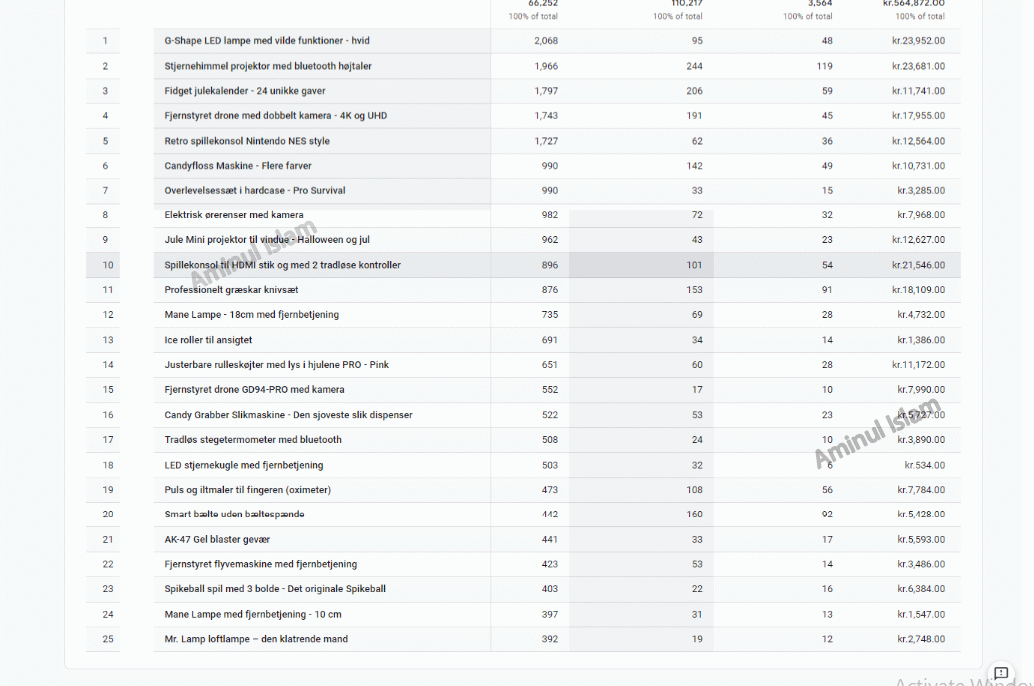
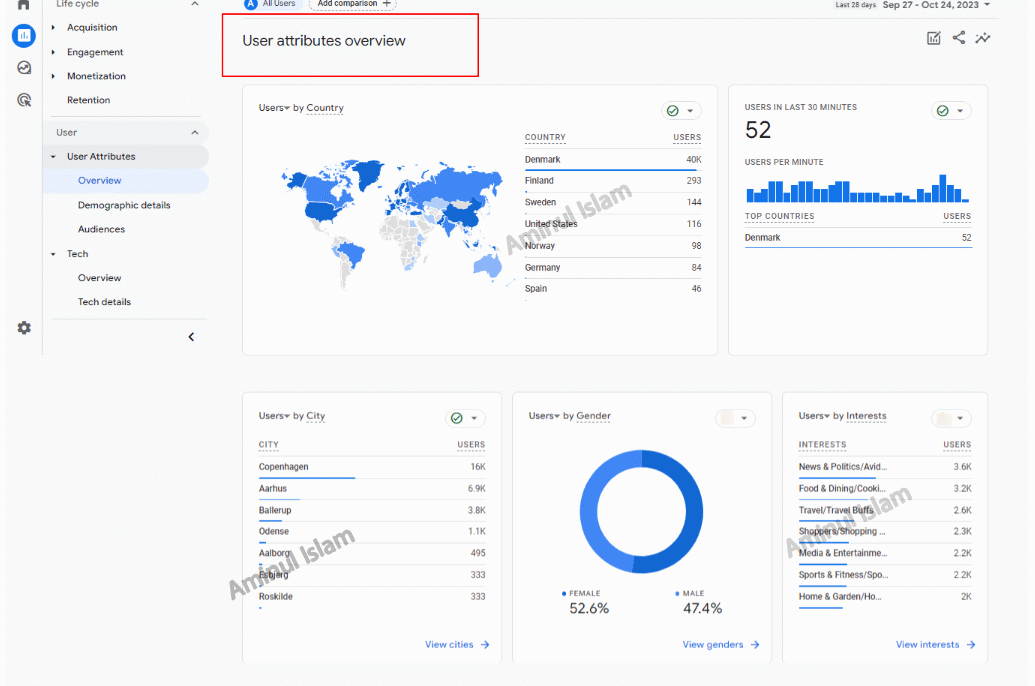
This Looker Studio report, powered by Google Analytics 4 data, provides clear and actionable insights into business performance. It features visualizations of sales performance by product category and region, inventory forecasts, and outlet trends. Key metrics such as closing inventory, days of stock, and average sales offer a comprehensive view of operational health. With interactive filters for category and brand, the dashboard allows users to easily explore data and make informed decisions about inventory and business strategy.
Book a Free Consultation